Experiment Analytics
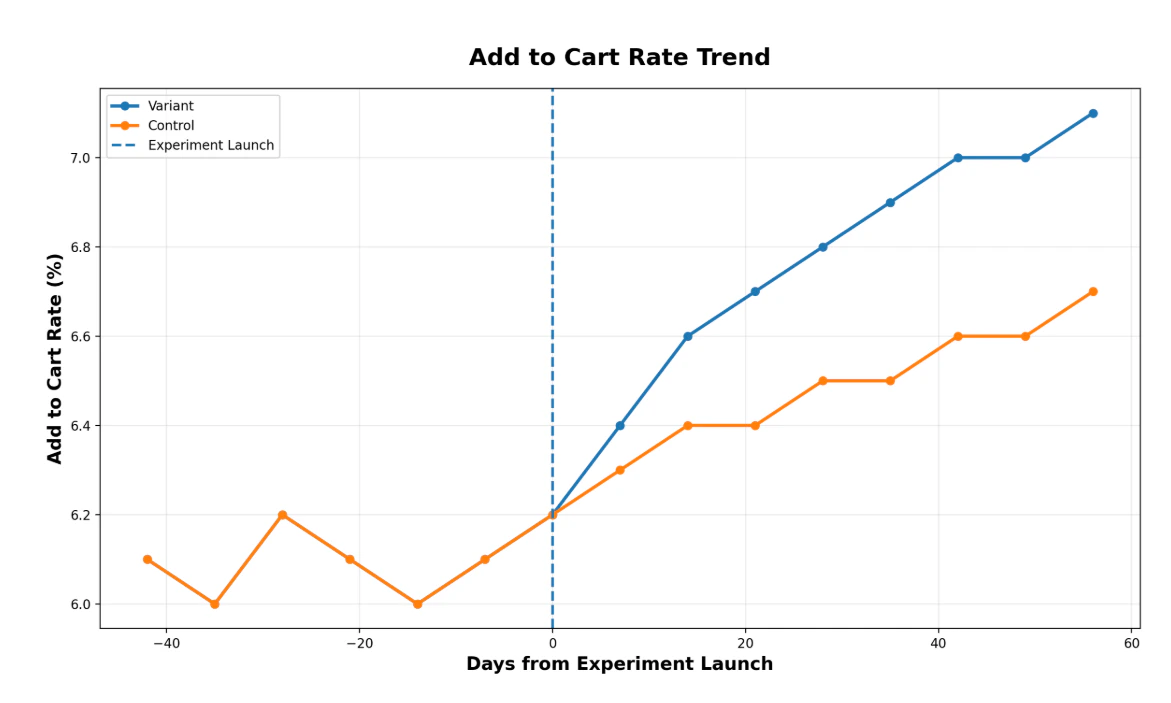
Each experiment includes a set of graphs that compare variant and control performance over time.- The blue line represents the enriched products (variant)
- The orange line represents the original products (control)
- The vertical line marks the treatment date, when enriched products were published
- The horizontal axis shows days from treatment
Products in the experiment
The Products tab in the Performance view displays all products included in the experiment. This is a read-only view that allows you to review which products are included in the experiment and verify the scope of your results.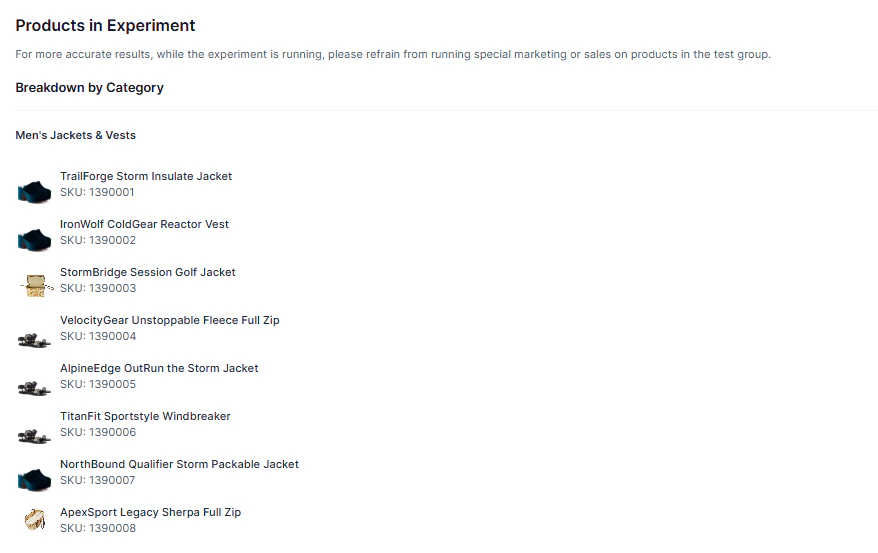
Prerequisites
- Ensure you have created at least one Experiment in Activate.
Procedure
The following procedure details how to access data in Performance.Viewing experiment metrics
- In the left menu, click Product Agent > Monitor. The Monitor page is displayed on the Visibility menu.
- Click Performance. The Performance menu is displayed. It shows all experiments, including their status, start and end dates, and progress.
- To view the details of an experiment, hover over its title and click View Details. The experiment is displayed on the Analytics menu.
-
(Optional) To view the products in the experiment:
- Click the button at the top-right to download a CSV file of the products in the experiment.
- Click Products to view the products in the experiment, broken down by category.